Friday, October 31, 2014
Tuesday, October 28, 2014
Thursday, October 23, 2014
weekly post #7

Here is a proportional symbol map. It shows the number of hunting license holders per state in 2013. I think it shows the data well although it is somewhat hard to read in the Northeast because all the states are so close together and the symbols are so big so it is hard to see what symbol represents what state.
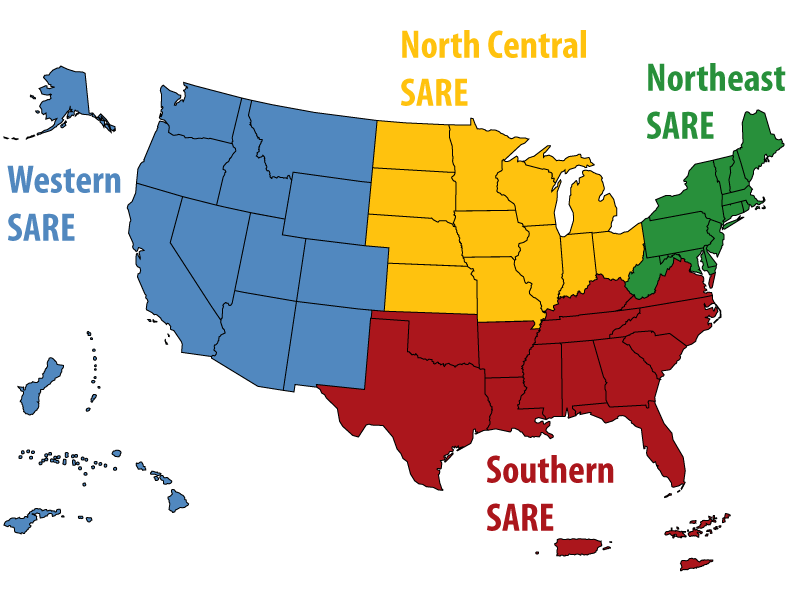
weekly post #6 color!

I think this map shows color really well and it easily shows the different parts of the country in different colors.
Tuesday, October 21, 2014
Lab #6
I do see a difference in my paper and digital maps. For me I think that my paper version you see the drop shadow better, you can see more depth than do you do on my digital copy. My digital copy however I think you see the gradient better than you do on my paper copy. Either one it shows my data well in the equal intervals, and finally moving into color is easier than the grap scale for all the colors of the states!!!!!!!!!
Thursday, October 9, 2014
Thursday, October 2, 2014
Subscribe to:
Comments (Atom)


